¶ The Dashboard
We have designed our system to show the Dashboard as the landing page that beautifully summarizes the entire work of the given day. This becomes handy to plan your day as early as possible. Ultimately its meant to improve analytics and Productivity.
The Dashboard shows metrics grouped under modules [Overall, Gather, Create, Publish Story Summary ]:
- Overall Report [ Social Shares, Stories Shared, Handles Configured, AMP Error, Total News Published ]
- Reporter Module [ # Reporters, # Submitted Stories, # Accepted Stories. #Rejected Stories, #Pending Stories ]
- Feed Ingestion [ # Feeds Configured, # Content Ingested ]
- Story Counts [ # News Published, # Stories in Progress, # AMP Stories Published, # Custom Content Published
- Others [ # Editors Logged, # Comments ]
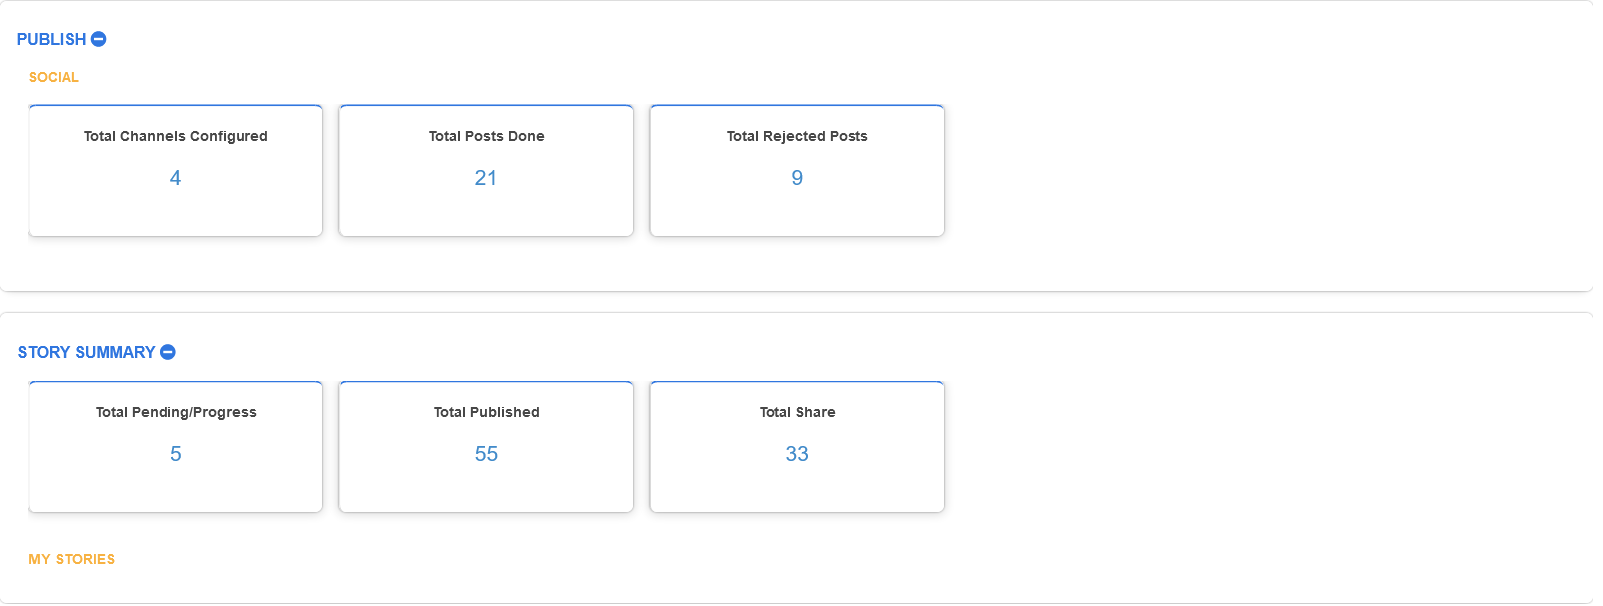
- Social [ # Channels Configured, # Posts Done, # Rejected Posts ]
- My Stories [ # Pending/Progress, # Published, # Total Share
¶ Actions on Dashboard
The Dashboard page has only two actions:
- Time Filter : You can filter and see contents that are published in last 1H, 12H, 24H & 1 Week
- Go To Page: When you click on a Blue highlighted number on any summary box, it takes you to the respective page / section
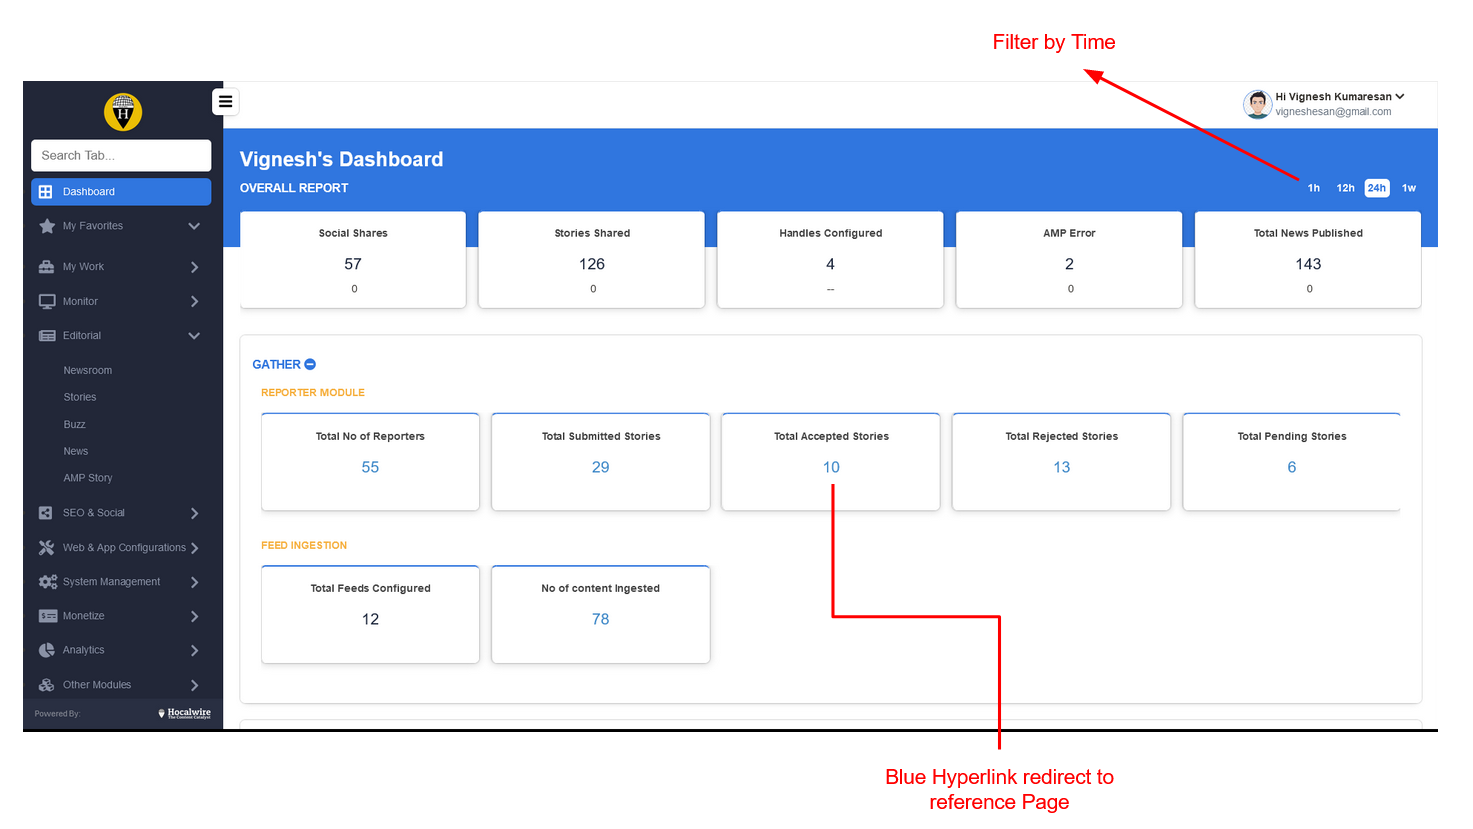
¶ Overall Report
The First row of the Dashboard will show the vital information such as Social shares, Stories shared, Handles, Errors & Total News published.
It will also indicate the percentage of increase in Green and decrease in Red, for easy understanding.
¶ Gather Metrics
The stories that flow in to the CMS can have multiple sources like Wired Agencies, RSS Feeds, Subscriptions to API and Reporter Teams. All the streams of submissions are summarized under the following Headings.
- Total Number of Reporters - # Reporters who have are available on the System
- Total Submitted Stories - Quantity submitted by those active reporters
- Total Accepted Stories - Accepted by the chief editor / personnel to be taken for publication
- Total Rejected Stories - Disqualified stories that are not taken up for publication ( Decision depends on Organization Structure )
- Total Pending Stories - Stories that still haven't got any accepted or rejected status and awaiting an action to be performed by the Editor
¶ Create Metrics
This section primarily focuses on the most important parameter to be measured.
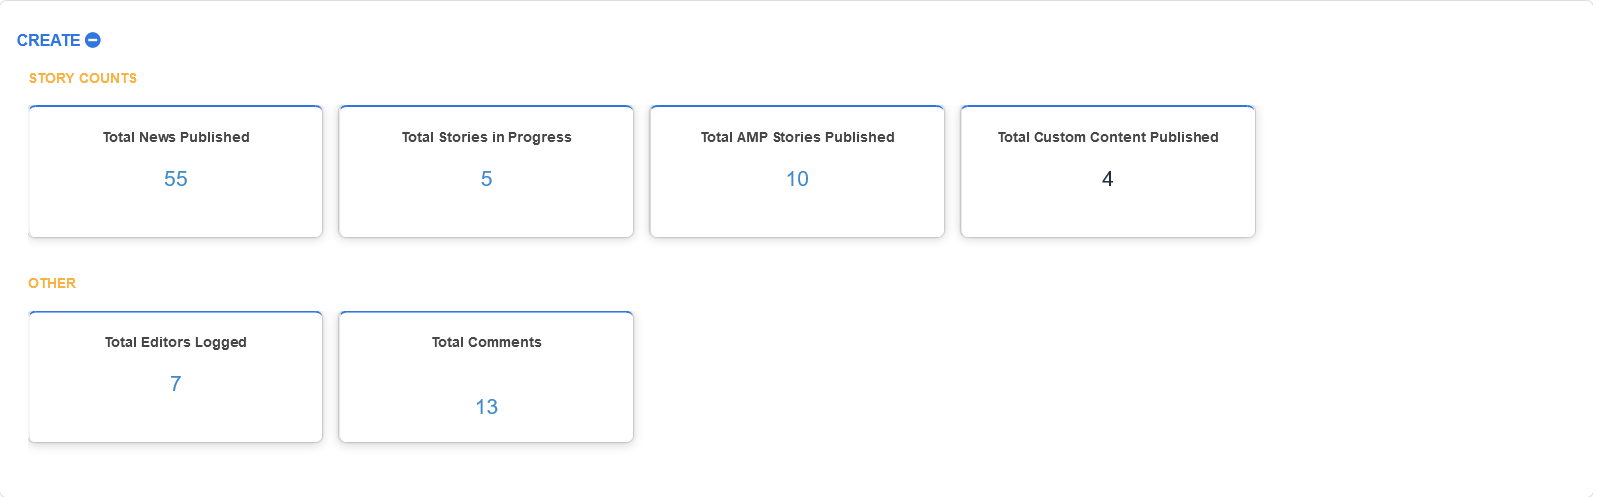
Total News Published in the given timeline. This helps people to monitor their daily targets and improve publication performance.
Total Stories in Progress - This metric is basically the Work in Progress Index. Total number of articles that are being created at the given moment. These also include articles that are in review and has not been published.
Total AMP Stories - Same as the Total News Published but exclusively identifies AMP ( Accelerated Mobile Pages ) that have been designed and taken live.
Total Custom Content Published - Any content format that has been designed by the publication that are not part of the default Hocalwire format.
Content Category - If your publication has multiple category/divisions like Sports, Finance, Education for example. This section gives metrics on number of articles published under each category.
Writer Report - A summary of news published by writers in the publication. This highlights the metrics for the chose time period. Overall results can be gathered in custom dates function.
Others - These are various other metrics on Editor Overview, comments and custom reports requested as per the publication and your payment plan
¶ Publish & Story Summary Metrics
This section focuses on the distribution of the news across multiple channels. Usually done and configured for a longer period of time it shows - Number of Social Media Channels configured to distribute the stories. Number of posts done across the configured platforms and Number of Rejected Posts for social media posting.
The Social Media Platforms include:
- Koo
- and Others
¶ Stories Summary:
Same as the overall metrics under each section. The Stories Summary highlights the individual metrics for the user who is logged into the system. This is used for individuals to measure and improve their performance and meet every day goals and long time targets.
- Total Pending /Progress: Number of stories that are in Create/ Edit Mode and not published still
- Total Published - Stories that are approved and published by the editor
- Total Share - Total Number of Social Media share for the stories published by the writer