¶ H-Analytics
This is the module which reports the performance metrics of the Writers, Authors & Editors in the Newsroom. It offers various filters, category and reports that are essential in improving the success rate of the Newsroom.
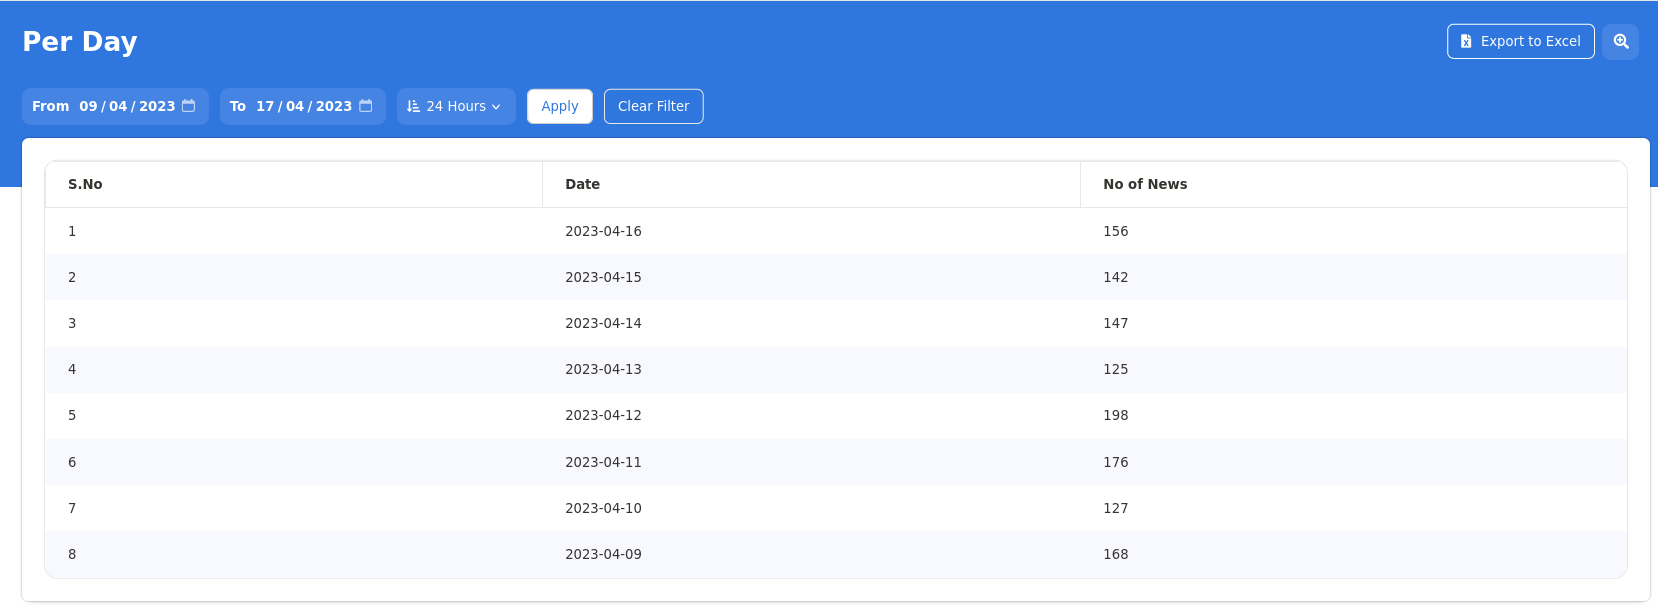
¶ Per Day Report
This view generates the number of stories published in a day. You can also set custom date ranges or use the predefined Week, Month or Year Filter Option. The Export to Excel button in top right corner downloads the data to a spreadsheet.
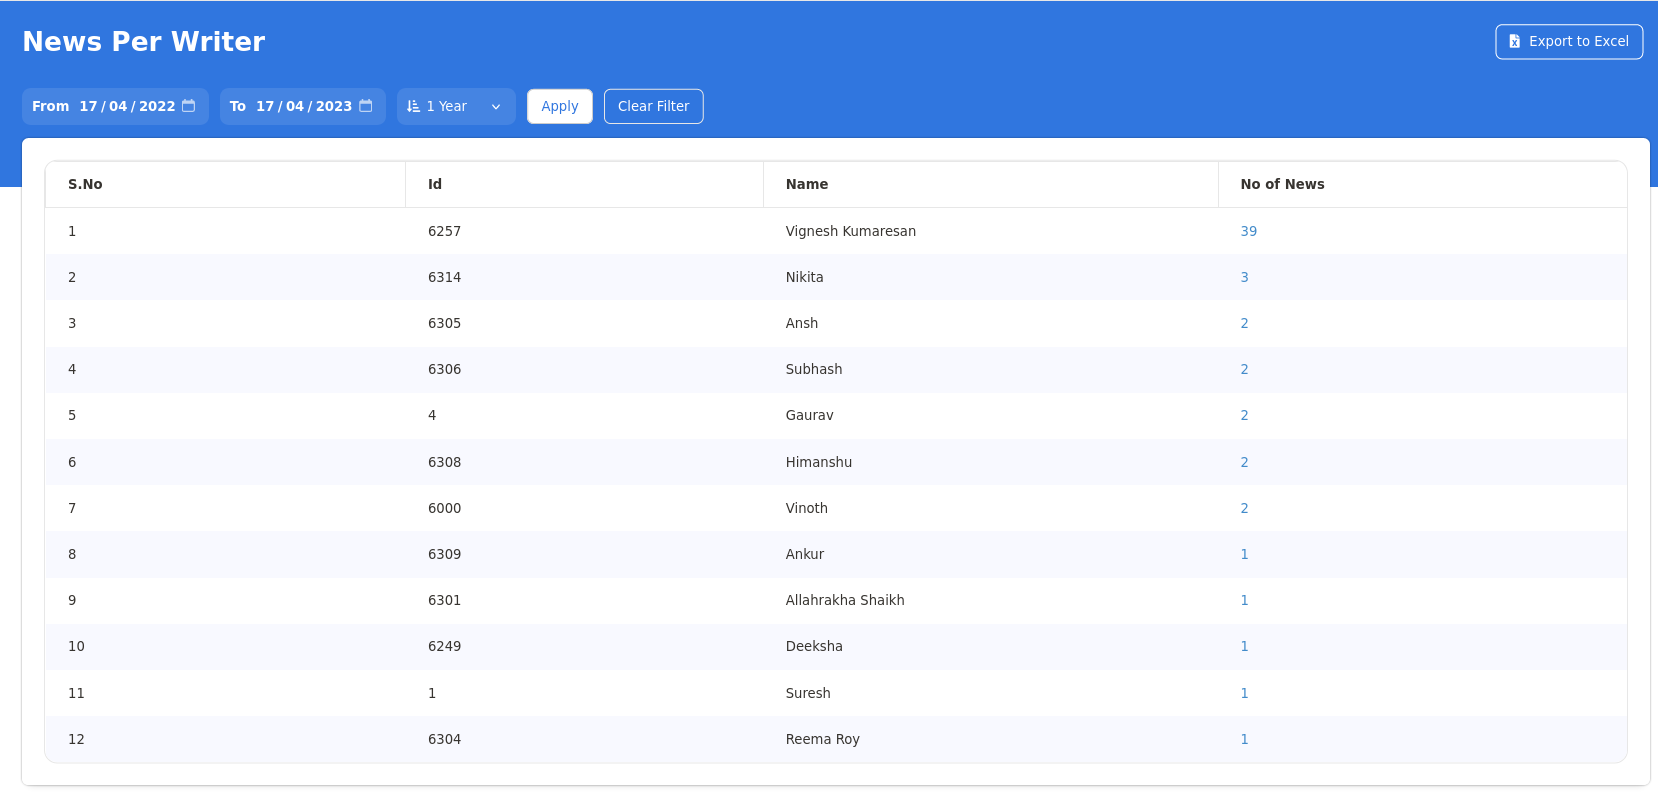
¶ Per Writer Report
This view generates the number of stories published by a Writer, in the chosen time period. You can also set custom date ranges or use the predefined Week, Month or Year Filter Option. The Export to Excel button in top right corner downloads the data to a spreadsheet.
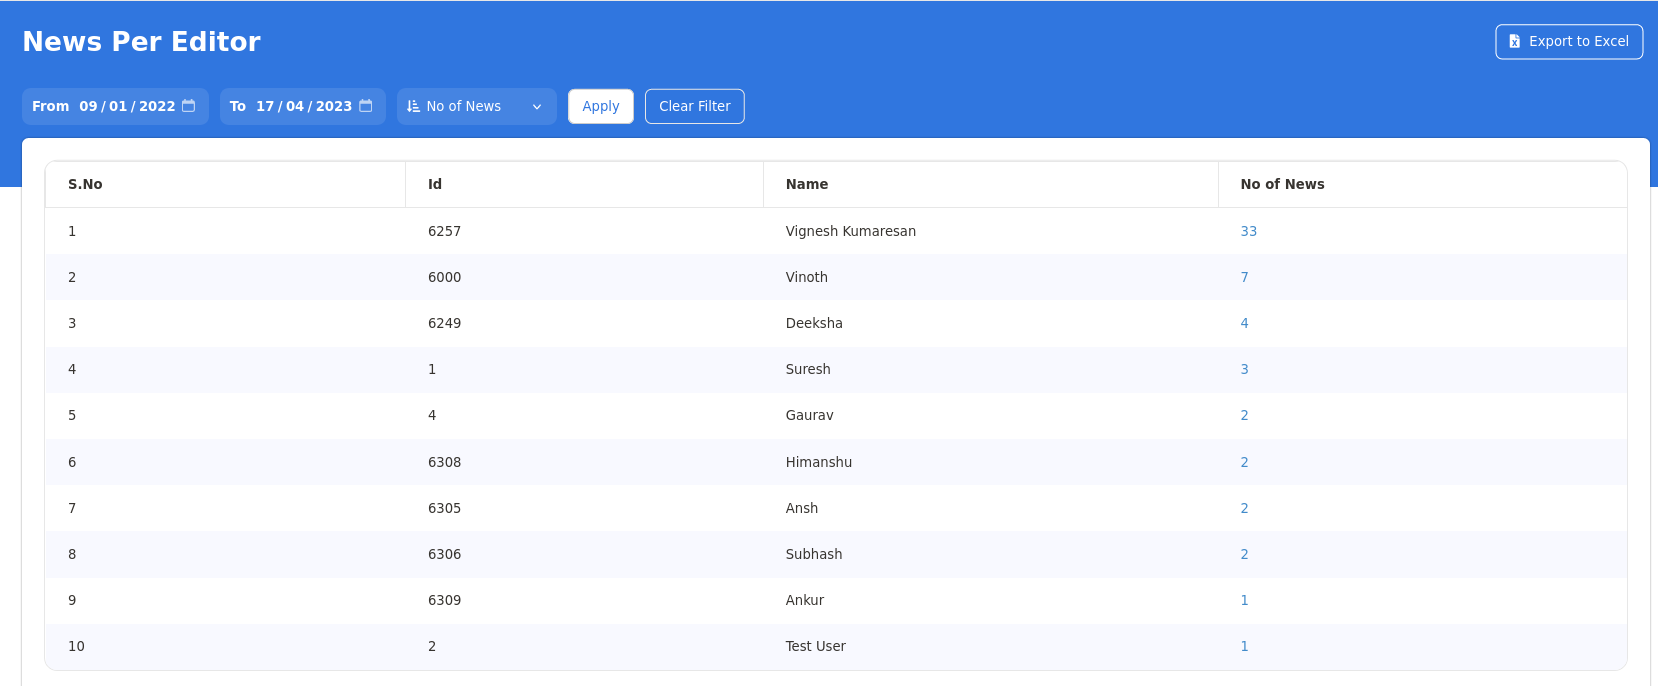
¶ Per Editor Report
This view generates the number of stories published/approved by a Editor, in the chosen time period. You can also set custom date ranges or use the predefined Week, Month or Year Filter Option. The Export to Excel button in top right corner downloads the data to a spreadsheet. There is also an option to fetch the data using GA Views.
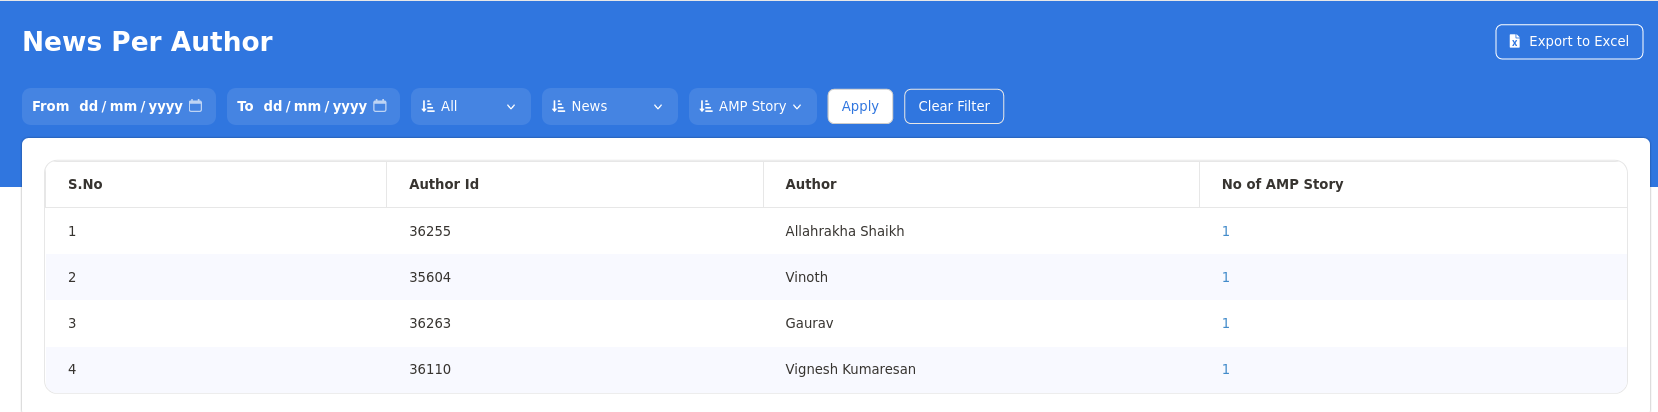
¶ Per Author Report
This view generates the number of stories written by an Author, in the chosen time period. You can also set custom date ranges or use the predefined Week, Month or Year Filter Option. The Export to Excel button in top right corner downloads the data to a spreadsheet. Additionally we can choose the type of story as News or Photo Story.
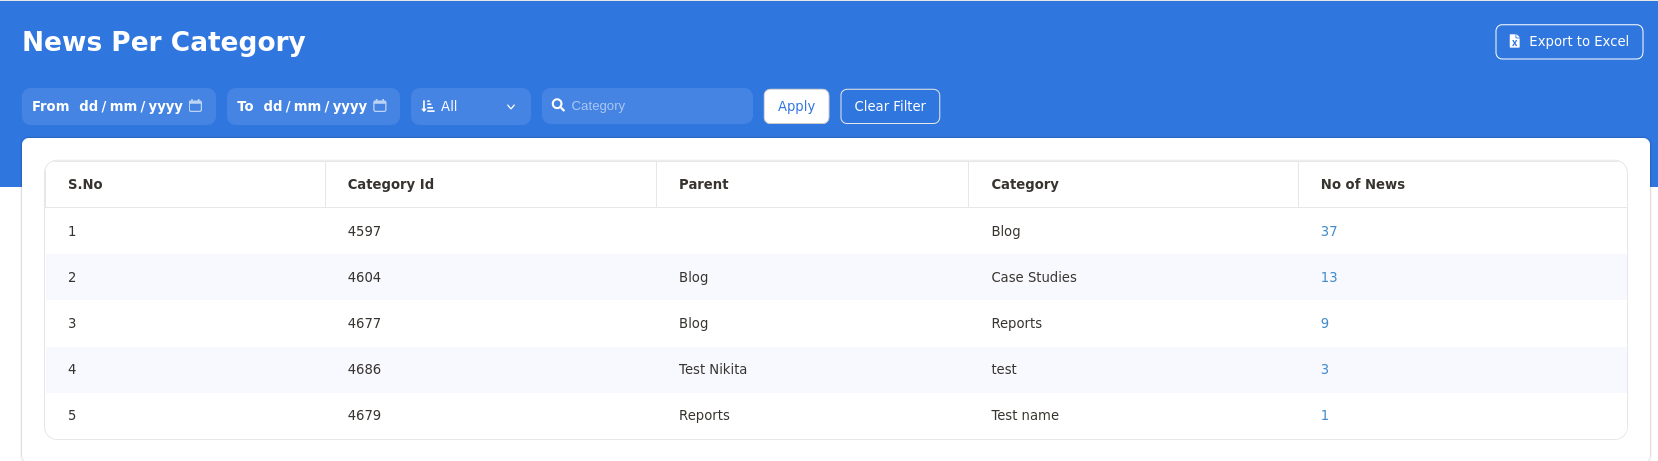
¶ Per Category Report
This view generates the number of stories published under all categories or specific category, in the chosen time period. You can also set custom date ranges or use the predefined Week, Month or Year Filter Option. The Export to Excel button in top right corner downloads the data to a spreadsheet. There is a search button to look for Category Names and shows the Parent Category in result as well.
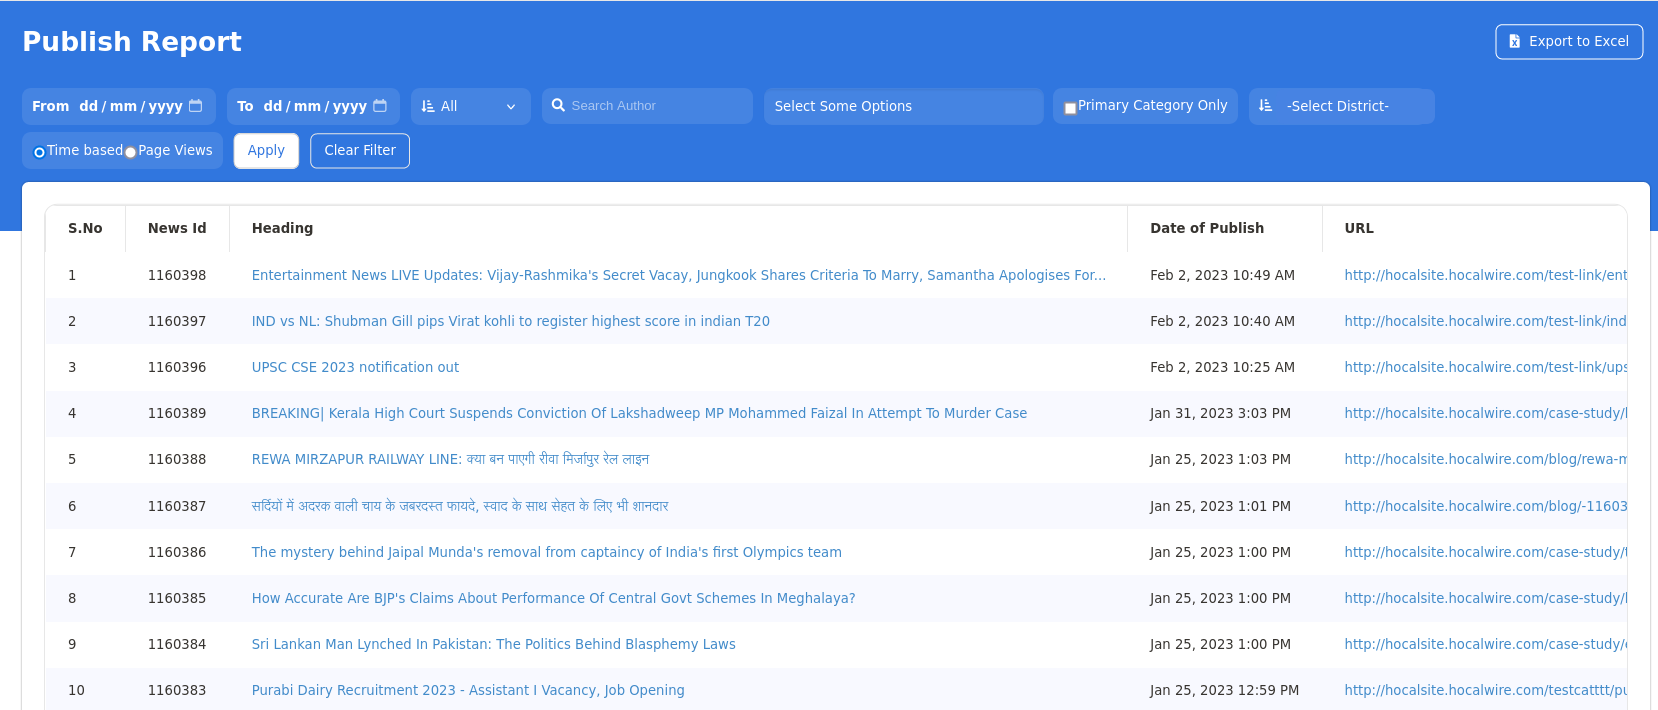
¶ Publish Report
This is the consolidated view of the stories/news that are published and we have multiple filters like Date Range, Search and Category to get results. There is also an option to filter results based on Time & Page Views. The Export to Excel button in top right corner downloads the data to a spreadsheet. The slider in bottom of the page lets you scroll to the right and see all the data points.
The result page consists of the following parameters:
- S.No
- News id
- Heading
- Date of Publish
- URL
- Author
- Editor
- Reviewer
- Category
- Tags
- View Count
- Image
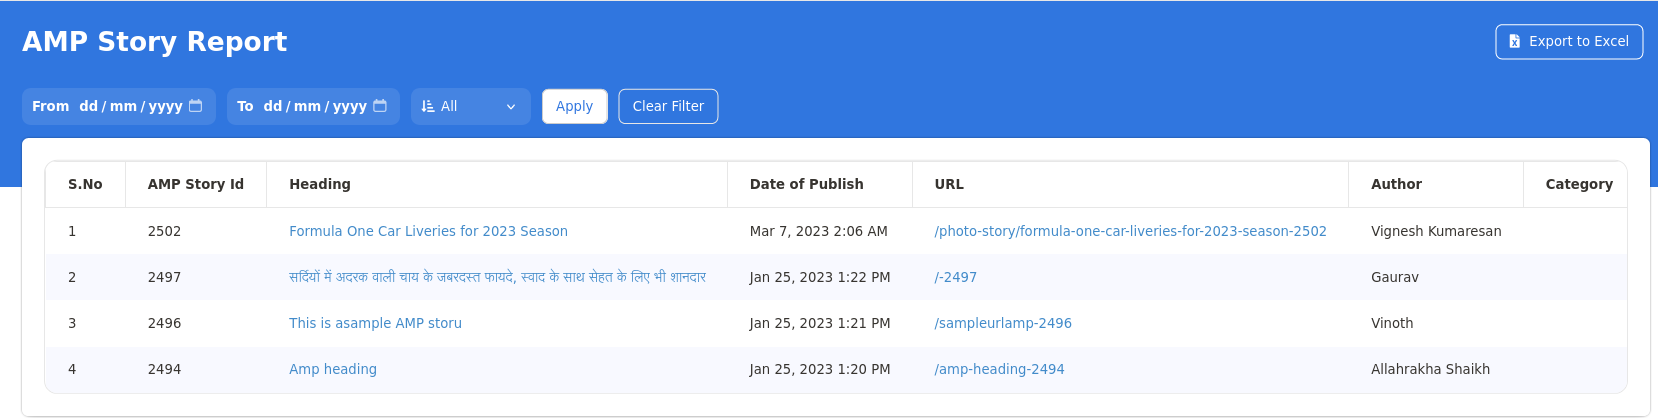
¶ AMP Story Report
This view generates the details of AMP Stories published, in the chosen time period. You can also set custom date ranges or use the predefined Week, Month or Year Filter Option. The Export to Excel button in top right corner downloads the data to a spreadsheet. The slider in bottom of the page lets you scroll to the right and see all the data points.
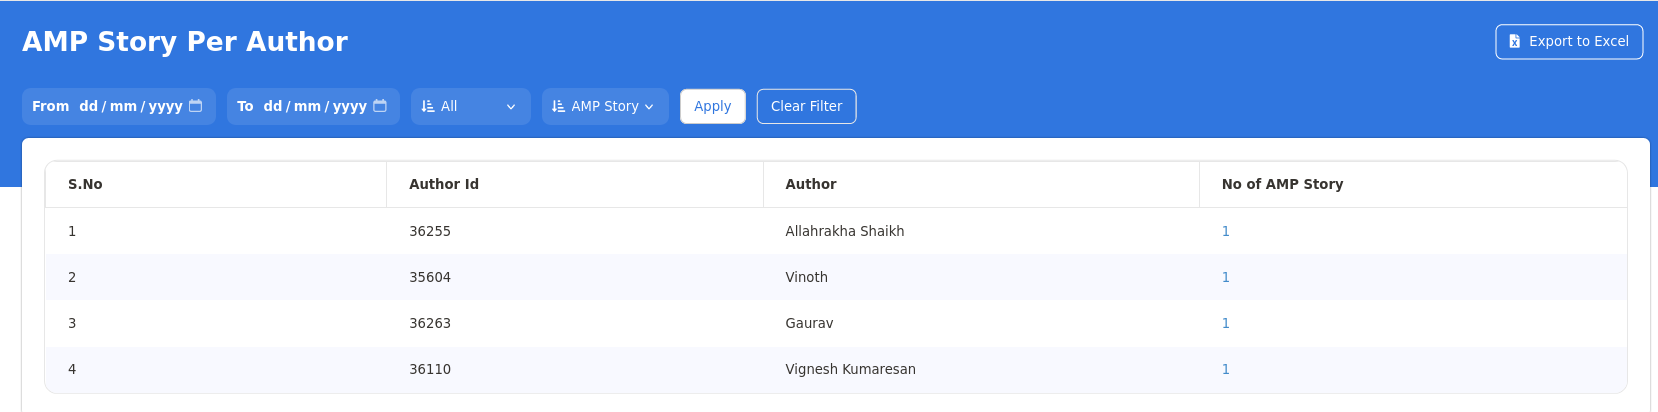
¶ AMP Per Author Report
This view generates the number of AMP Stories written by an Author, in the chosen time period. You can also set custom date ranges or use the predefined Week, Month or Year Filter Option. The Export to Excel button in top right corner downloads the data to a spreadsheet. Additionally we can choose the type of story as News or Photo Story.
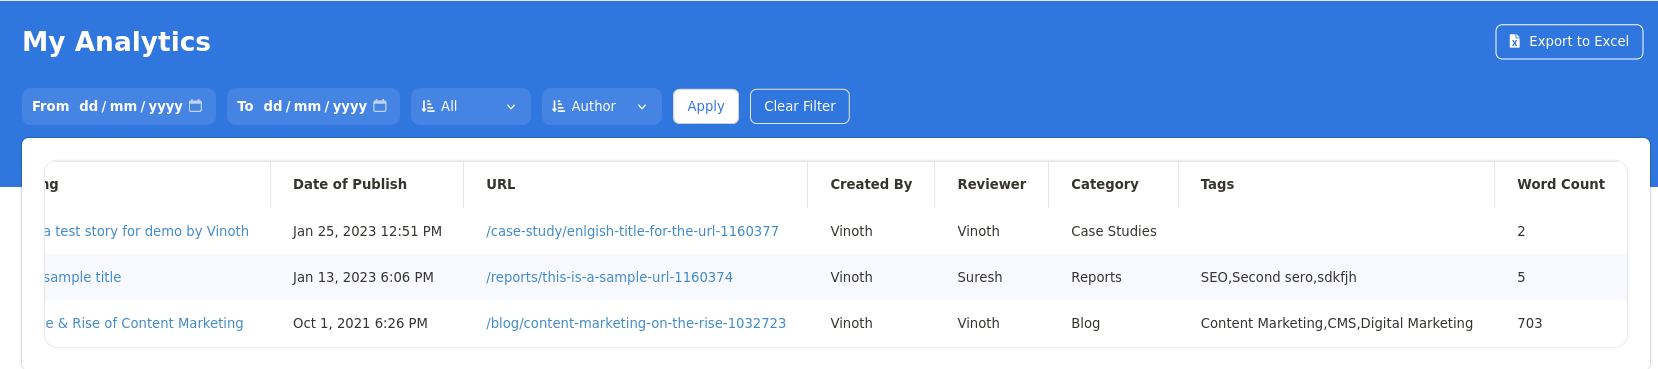
¶ My Analytics
This view specially filters out the details of the stories published by the User who has logged In. You can also set custom date ranges or use the predefined Week, Month or Year Filter Option. The Export to Excel button in top right corner downloads the data to a spreadsheet. This shows some data points such as category, tags & word count. The slider in bottom of the table lets you scroll to the right and see all the data points.
By Credit - WIP
Feed Report - WIP
My Change Log - WIP
Reporter Analytics - WIP
CMS Login Analytics - WIP
PDF Download - WIP